What Should a Data Scientist's LinkedIn Summary Look Like?
Project Goal
- Finding Related Scientists with Natural Language Processing
Introduction
This post is a summary of the natural language processing (NLP) project I worked on during my time at Metis data science bootcamp. Coming from an academic background, I was interested in seeing how other data scientists from academia describe themselves on LinkedIn. In such a case, how should a data scientist transitioning from academia to industry write his/her LinkedIn bio?
Project Overview
Data acquisition. Due to legal issues surrounding scraping LinkedIn, I used summaries of scientists archived on wikipedia. These articles were gathered using wikipediaapi, which collects one title at a time. I created a (for-loop) function to iterate this process over a list of titles, generated from PETSCAN. To collect this list, articles with Category: Scientists (at depth:2) were requested; PETSCAN returned ~15,000 articles under this category. A variety of related articles were also collected during this acquisition, and these articles may not describe “real” scientists. For example, ‘Data’ - a Star Trek character - was also included in this Scientists group.
Pre-processing. Once I finished collecting 1-2 paragraph summaries of these scientists, I preprocessed the corpus by removing duplicates and dropping easily recognized, unrelated entries. Dropping some of the “not real scientist”-articles ended up reducing the total number of summaries down to ~13,000 (a more extensive cleaning was necessary to remove all unrelated articles).
To convert each wikipedia summary into a document-to-term vector, I applied a Term Frequency-Inverse Document Frequency (TF-IDF) vectorizer, removed (english) stopwords & punctuations, and included tri-grams. This process resulted in a matrix with ~13,000 rows and ~1.2 million features (words) for the entire corpus.
Unsupervised learning. I then applied Non-negative Matrix Factorization (NMF) to reduce the matrix dimension and to model the appropriate topics describing these documents. Nine topics seemed reasonable, as the top keywords appearing in each topic seem to convey distinct ideas from another.
Subsequently, I used cosine similarity to find the closest neighbor between a given a query. Vectors with cosine similarity values approaching 1.0 indicate articles that were most similar to the given query.
Topic Modeling Result
The application of NMF to the document-to-term matrix resulted in 9 distinct topics modeled (Figure 1). Based on the keywords, these topics seemed to describe scientists that related to:
- Academia
- Comic books (*)
- Indian origin
- Fictional characters (*)
- European origin
- Russian origin
- Computer Science (data scientists included)
- TV characters (*)
- Physicists
Based on these descriptions, Topic 2, 4, and 8 are not real scientists. Articles assigned to these topics must have been included in the acquisition process, as they have some relationships on some level with other articles categorized under Category:scientists (described above). Topic 5 (European) includes repeated keywords of months e.g., april, march, february, etc., corresponding to people’s date of births in the wikipedia summaries.
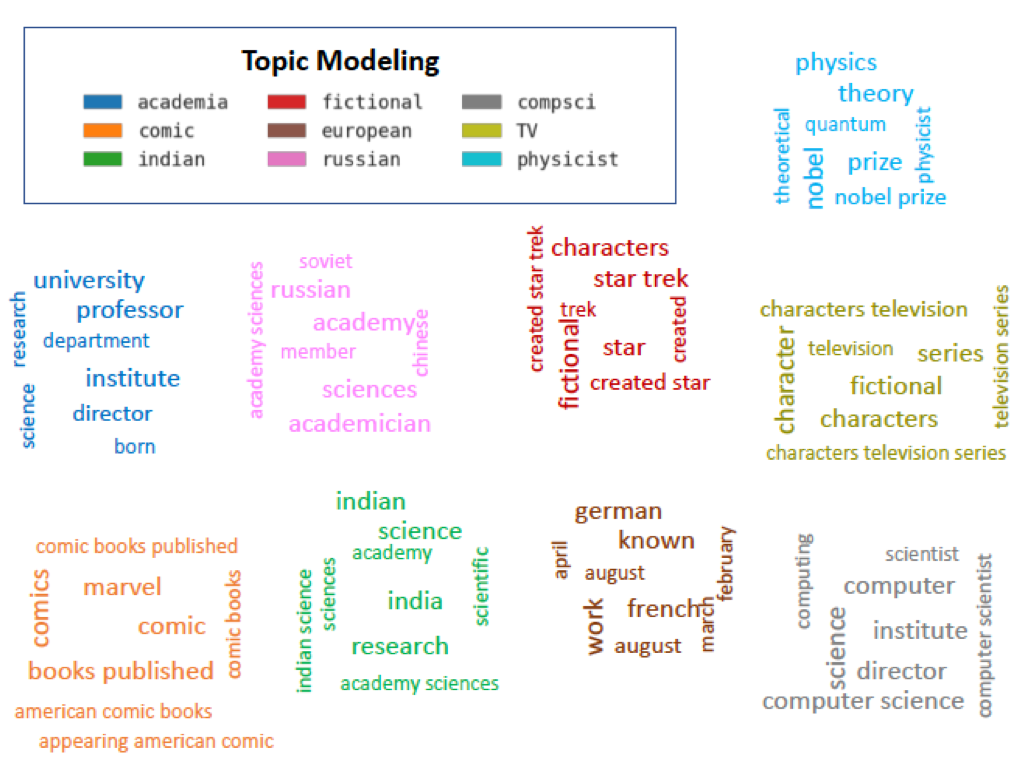
Figure 1. Top 8 keywords appearing in each of the 9 modeled topics. Clouds were created manually on powerpoint, to avoid redundant and repetitive words. Variation in font sizes were added for visual effects, but it does not reflect the word’s frequency in the documents.
The distribution of topics in the dataset is illustrated using t-SNE representation (Figure 2). A given article was assigned to a single topic, based on its highest topic probability. Distances in the hyperdimensional space is also reflected in this 2D projection, i.e., points that are close to each other correspond to similar documents.
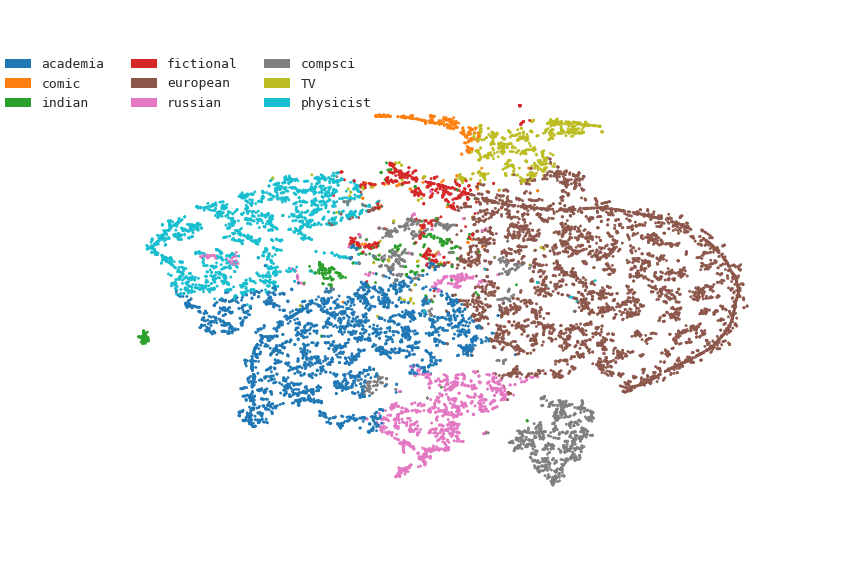
Figure 2. t-SNE representation of various articles about scientists in different domains, archived in Wikipedia. Each point corresponds to an article (i.e., scientist) and the assigned color reflects its highest probability for a given topic.
Data scientists are included in the computer scientist group. In particular, Hadley Wickham’s description in wikipedia is considered by the model as a computer scientist (gray), with high similarity with other scientists in academia (blue) (Figure 3). As it turns out Hadley Wickham - a famous data scientist - is also an adjunct professor in Auckland, New Zealand. Hence, Wickham’s position near the academic group in the t-SNE plot seems reasonable.
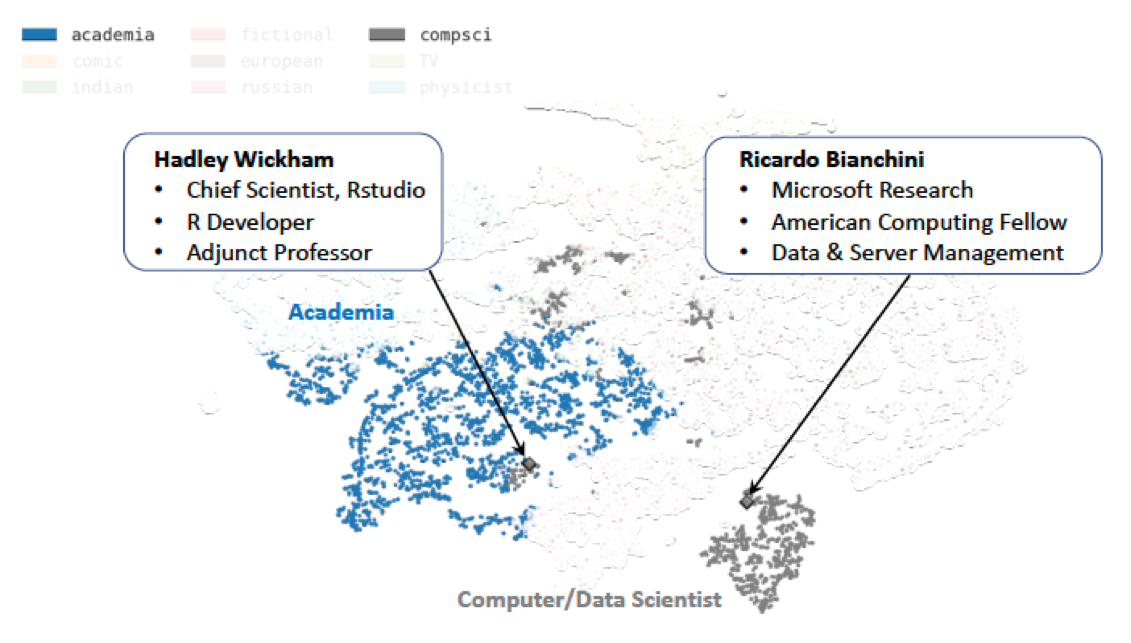
Figure 3. t-SNE representation of wikipedia articles about scientists related to academia (blue) and to computer science (gray). Each point corresponds to an article (i.e., scientist) and the assigned color reflects the highest probability for the assigned topic.
The 10 articles that are most similar to Hadley Wickham is shown in Table 1. Based on cosine similarity, articles that are closely related to Hadley Wickham include computer/data scientists, as well as others in academia. These similarities are reflected by the close proximity of the corresponding points in the t-SNE representation (Figure 3).
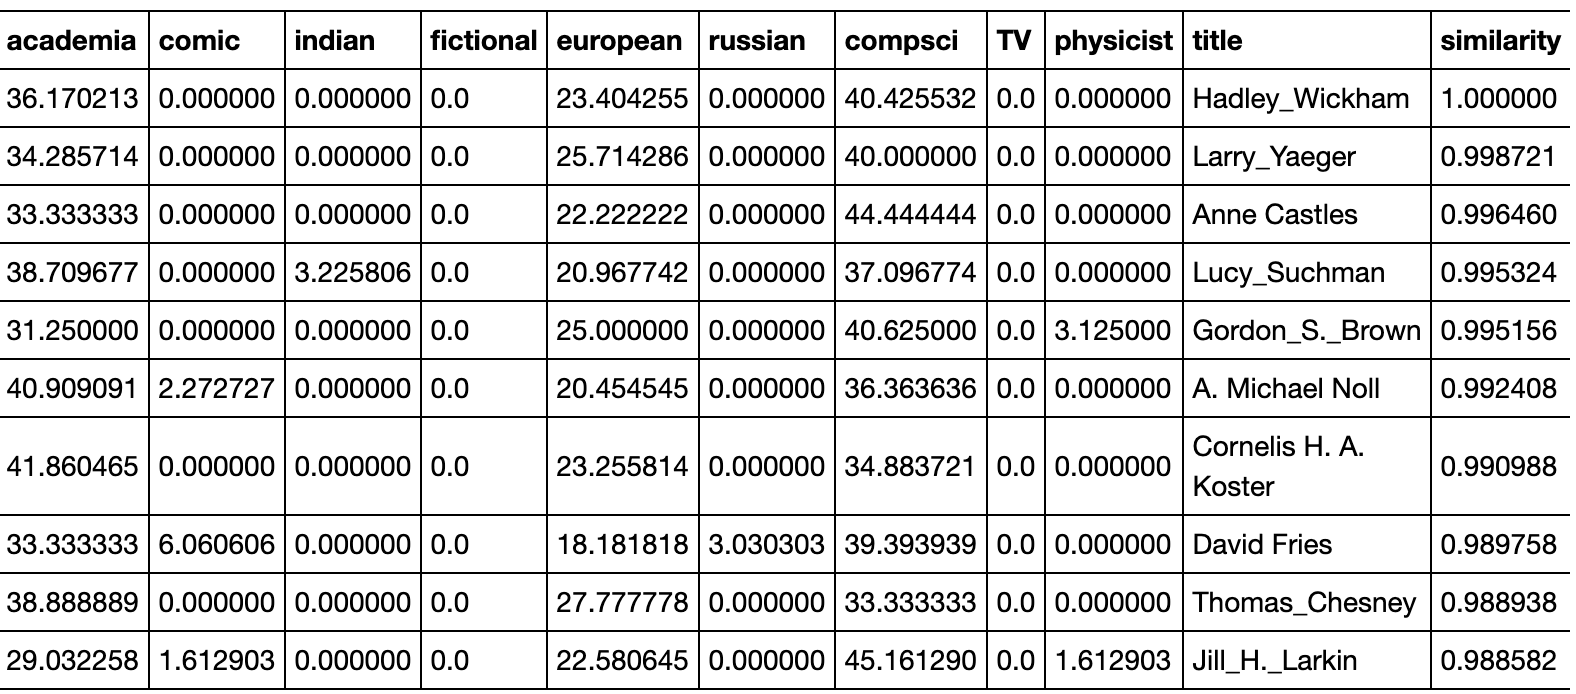
Table 1. List of top 10 most related scientists to Hadley Wickham, based on wikipedia summaries. Each row corresponds to an observation, i.e., transformed vector for a scientist. Values in each column represent elements in the vector, expressed in percentages. For each observation, the topic assigned in t-SNE (Figure 3) reflects the highest percentage among the 9 topics.
Summary and Conclusion
This NLP project was really fun to work on, as it attempts to answer a question that is pertinent and common to people who are entering data science, i.e.,
- How should I tell my story about how I transitioned into data science?
The term data science itself didn’t become popular until the past 5-6 years. Since then, its popularity has increased exponentially. On a daily basis, people with diverse backgrounds are striving to enter the ever expanding field of data. The answer to my original question could also be pertinent to recruiters and companies who are looking to hire data scientists. My hope is that the outcome of this study may provide a path towards a sweet spot, where employers and potential employees can meet each others’ expectations.
Checkout the Tableau dashboard in real-time here
Future work
-
More cleaning and collecting quality data targeting the data science field. At the current stage, the data is still messy! There’s quite a handful of “fake” scientists, which are ‘fictional’, ‘comic’, and ‘TV’ characters that appear in the topics. It would be nice if LinkedIn data was legally available. The number of data scientists in wikipedia is also limited. Hence, the model could not distinguish a data scientist vs. a computer scientist. It would be interesting to combine this text exploration with a supervised learning project that classifies whether a person categorized as a computer/data scientist (on LinkedIn) actually works as a data scientist.
-
Automated text generation. In a distant future, it would be exciting to create a deep learning model that generates a full description about someone, given specific attribute about him/her as seed.
Data Sources and Tools Used
- Articles from Wikipedia
- Data acquisition:
PetScan,wikipediaapi - NLP and data analysis:
Pandas,seaborn,nltk - Unsupervised learning:
Scikit-learn,TruncatedSVD,nmf,kmeans - Data visualization:
t-SNEandU-MAP - Model deployment:
D3,Flask, hosted onHeroku(in development)