What Should I Cook Tonight?
Project Goal
- Building
Produce2Recipe: a Phone App that finds cooking recipes from photos of vegetables
Introduction
Have you ever looked at the vegetables in your refrigerator and wondered, “What can I cook with these?”
I find myself asking this question almost every week. I could spend ~30 minutes Google-searching and website-browsing, to find one recipe that matches stuff I have in the refrigerator and my cooking preferrences. In the past, I had explored a couple of cooking (phone) apps to help me find recipes. However, I kinda felt that most available apps had too many functionalties to navigate through, e.g., typing-in the ingredient keywords, choosing the dish types & cuisine types, and selecting a handful of other preferrences. Also, they didn’t yet have a way to find recipes simply by taking pictures of the ingredients.
So, I thought to myself, “Wouldn’t it be nice to use my phone to take photos of stuff in my refrigerator, and then get (personalized) recipes from them?” This idea came to me as I was attending an immersive data science bootcamp, I wanted to implement the different things I was learning at the time and integrate them into a single application, Produce2Recipe. The following video shows the app prototype I created in 3 weeks.
Challenges and Objectives. Creating a functional product within 3 weeks was not an easy task, as it required some engineering of different datasets. For instance, I had to collect and manage 2 types of datasets (i.e., images and texts), and I had to pre-process them separately. I also had to build an image classifier that is robust enough, to recognize vegetable photos taken using my phone camera. Then, the image classifier had to be fed into a document of recipes (i.e., corpus) which I wanted to apply natural language processing (NLP) to. In detail, here is my list of high-level objectives I needed to accomplish:
-
Collect recipes (text data) by web-scraping cooking sites (e.g., Epicurious). Include details such as titles, ingredients, cooking instructions, nutritional values, and photos during web-scraping
-
Collect images of produce from Google (API) for model training
-
Build a neural network image classifier to identify vegetables in my refrigerator
-
Pre-process recipes (text data) and tag those with appropriate categories (e.g., by topic modeling)
-
Build an end-to-end pipeline that takes in images and outputs recipes
-
Create a Flask app and integrate it with my cellphone somehow
The following figure illustrates my project design and the technology stack I used. I will briefly describe the 3 major parts in this workflow: (1) data acquisition, (2) model building, and (3) app deployment.
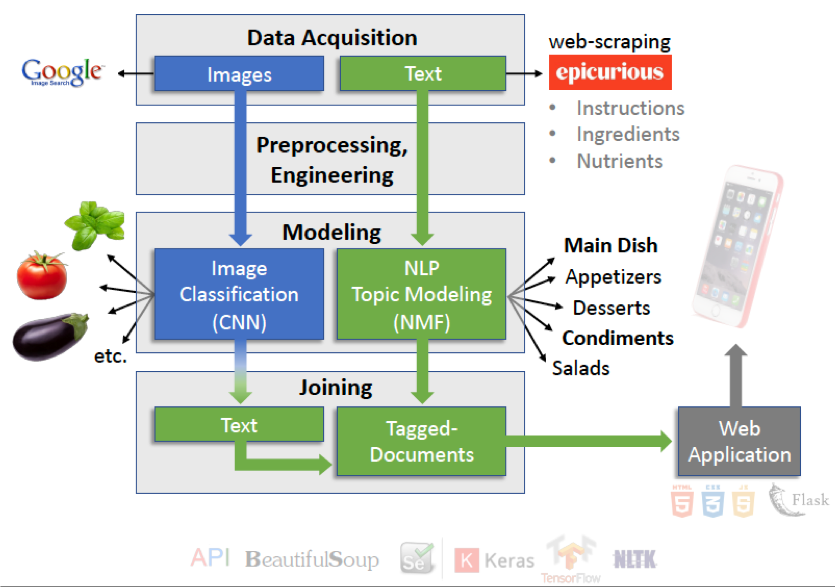
Part I. Data acquisition and pre-processing
Collecting images. Using google-image-download API, I collected 300 images for 15 different vegetable types (a total of ~4500 images). Then, I manually inspected each image to make sure that I acquired the right type of produce. For instance, I wanted to make sure that I collected photos of (raw) tomatoes, not tomato puree, often included in the search process. I also removed duplicate images from each collection of produce.
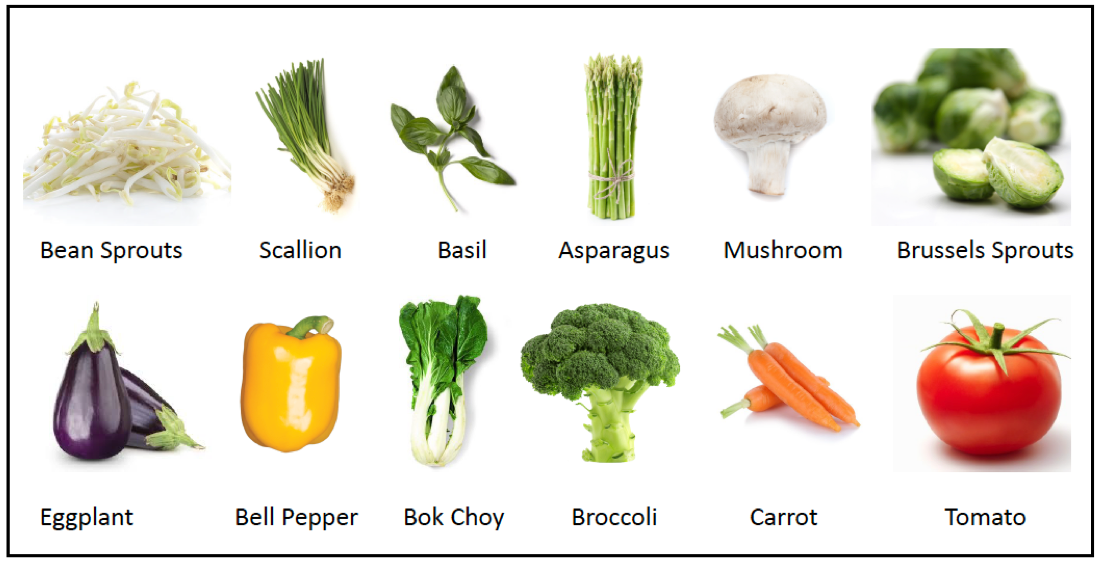
Splitting dataset. After removing duplicates and unrelated images, I found that some collections had fewer than 100 images. So I excluded these smaller collections from the library. Afterwards, only 12 classes of vegetables remained, and each class had at least 120 images. My model would learn how to classify each type of produce from 100 images (training set), and it will make guesses on 20 ‘unseen’ images to measure its accuracy (test set).
The figure below shows the 12 different classes of produce, used for model training. These vegetables include bean sprouts, scallion, basil, asparagus, mushroom, brussels sprouts, eggplant, bell pepper, bok choy, broccoli, carrot, eggplant, and tomato. These vegetables happen to be some of my favorite ingredients to cook with. So, I’d most likely have them readily available in my refrigerator, when the time comes to test my app (live demo).
Collecting text data. To obtain cooking recipes, I webscraped epicurious for ingredients, titles, instructions, nutritional values, photos, and (if any) categorical tags.
- Ingredients, titles, and instructions are the essential information I needed
- Nutritional values were collected, because I originally wanted to categorize each recipe as either ketogenic-diet-friendly or not, based on its macronutrient ratios (I removed this functionality in the demo)
- Photos were collected for later app implementation
- Any categorical tags were also acquired for further recipe personalization
Part II. Building an image classifier and modeling recipe topics
Building an image classifier. As I only had 3 weeks to complete this project, I chose to use transfer learning to classify produce images. I used some of the popular convolutional neural network (CNN) architectures as the base layer and trained the top layer with produce images in the training set. I also wrote a Python script that ran a grid-search to find the best combination of model parameters. The result indicates that the best combination uses MobileNetV2, rmsprop optimizer and softmax activation function.
Google’s MobileNet_V2 architecture was chosen as the base layer, as it is robust and light for mobile application. This base layer was connected to a fully connected layer with softmax function to classify different types of vegetables in my library. With this setup, I was able to get ~96% accuracy on my test set. In other words, my model performed really well, as it classified unseen images correctly about 19 times out of 20 images. The output of my image classifier is in the form of text format, which is used as keyword search against my recipe documents (described next).
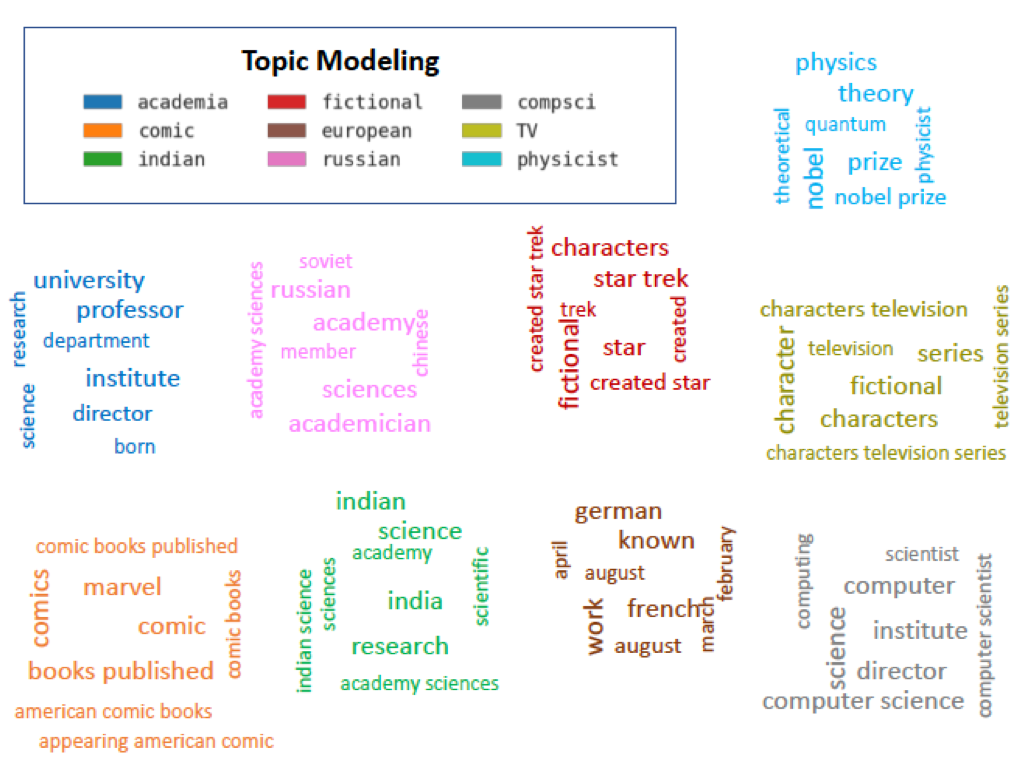
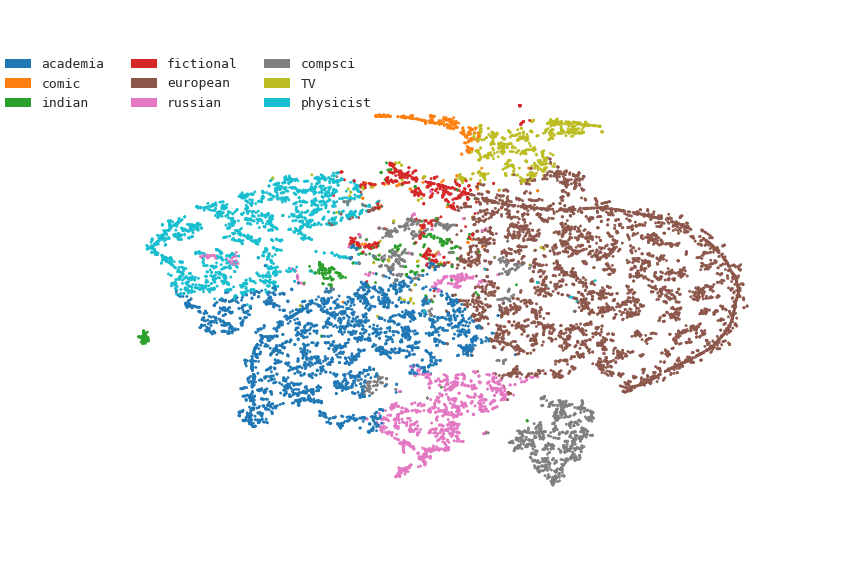
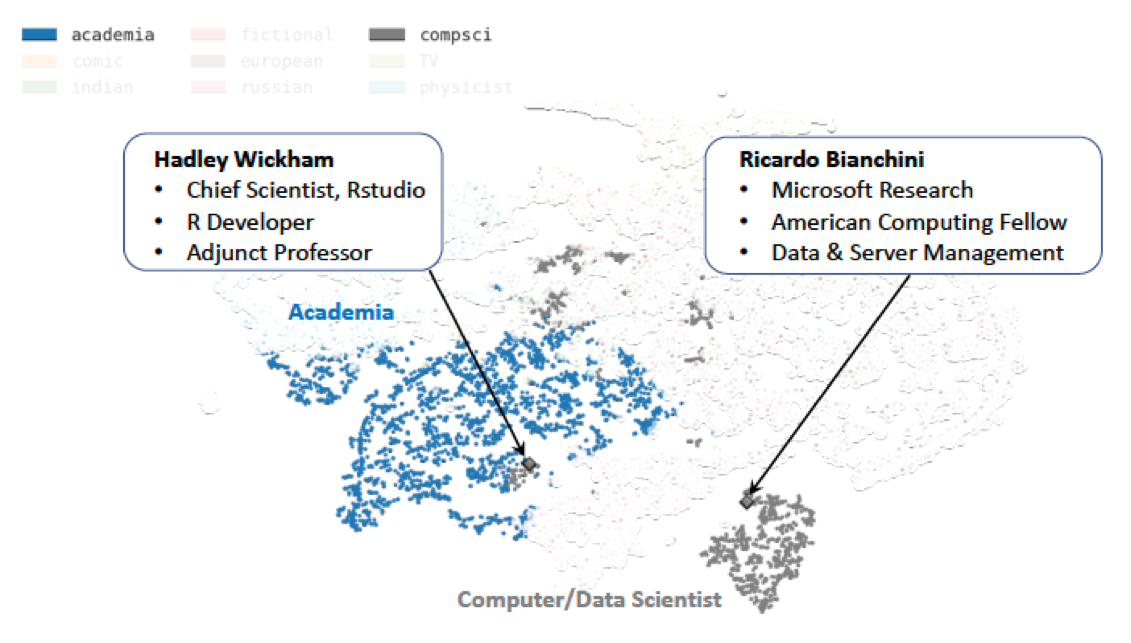
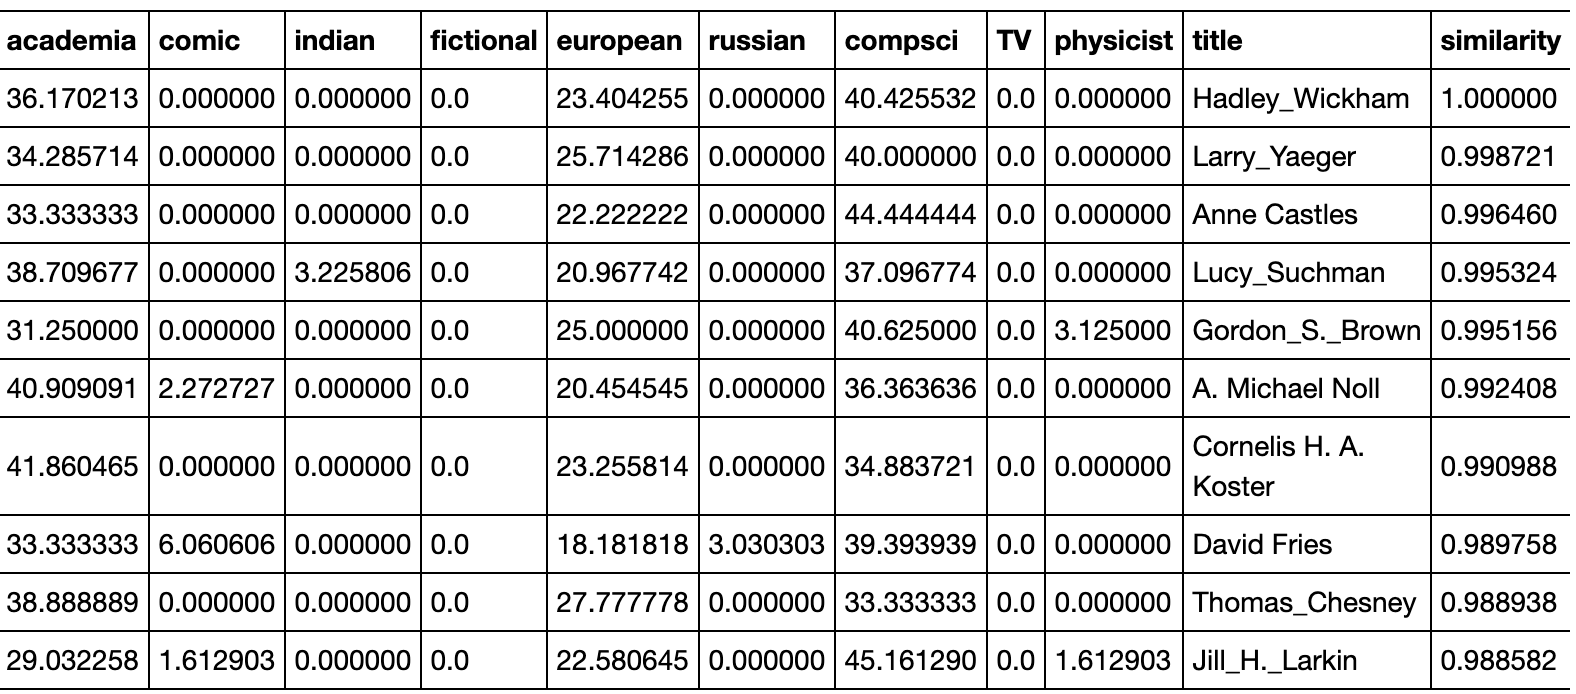
Creating tagged recipes by applying Natural Language Processing (NLP) technique. I used Non-negative Matrix Factorization (NMF) to perform topic modeling on my recipe collection. In other words, I wanted to characterize all of the webscraped recipes by a set number of similar themes/elements, which are described by certain frequently occurring keywords. In this case, 20 topics seem to represent my recipes resonably well. The top 8 keywords occurring in each topic seem to describe a common theme. The figure (below) shows examples of these topics and their corresponding top 8 keywords.
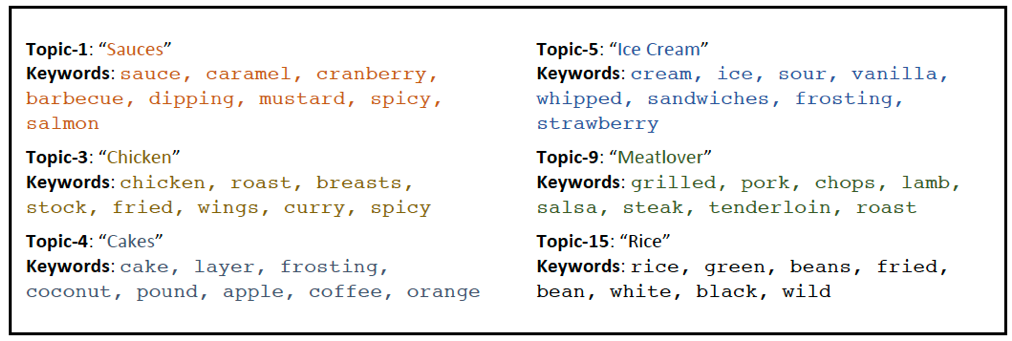
Designing a product with an end-user perspective. Having to choose 20 categories of recipes may be too much of a hassle. So, I wanted to simplify my recipe selection with fewer categories. I reduced the 20 topics down to (only) 5, by grouping similar themes together. For instance, cakes (Topic-4), ice cream (Topic-5), and other related sweets (Topic-8, -10, and -20) could be combined into one major group called dessert. The final 5 categories are main dish, side dish, salad, dessert, and condiments.
Building a Flask app for my phone. I created a Flask app that was accessed locally (public version coming soon). To run the app on my cellphone, I needed to take 3 photos, and email them to produce2recipe@yahoo.com. To get the result of image classification and matched recipes, I tunneled into this app (running on my local machine) with ngrok and my phone browser (see below for explanation of how I created a workflow to live-demo this phone app).
Part III. Creating a phone app prototype
To simulate a functioning phone app (shown in demo), I did 3 things:
- Ran the flask app locally on my Mac. I also added a line of code in my app’s
api.pyfile, to run an apple script (Automator) on my Mac. Basically, the script does the following tasks:- Delete all images in local
test-folder, - Go to
mailinbox (produce2recipe@yahoo.com) and collect new messages, - Find a message that contains image (attachment) and download them,
- Transfer these images to the
testfolder, - Go back to my API, and the image classifier
- Delete all images in local
-
Connected to the Flask app through my phone via
ngrok, which “exposes local servers behind firewalls to the public internet over secure tunnels”. Read more about ngrok here. - I captured 3 produce images using my phone camera and attached them to an email sent to produce2recipe@yahoo.com. The apple script (see no.1 above) extracted these images and loaded them into my CNN model. Then, the classifier output was used as keywords to find matching recipes in my tagged-document.
That’s it! I now have a ‘functioning app’ that classifies real images of vegetables, predicts their classes, and outputs matching recipes based on those images. The app lists recipes based on the number of matching ingredients. For instance, I could choose recipes with all 3 matching ingredients, or only 2 ingredients, or at least 1 ingredient.
This was a fun project, because I got to stitch different things together and deploy a product in the end. In the future, I’d like to transform this prototype into an iOS or Android app using Kivy.
Thank you for reading! Additional details and codes can be found in my repo.
Future work and offshoots
-
Larger database and broader scope. Epicurious only has ~38k recipes on its database, and many of them are missing info that I wanted to use for my project (like nutritional values). In the future, I’d like to webscrape several websites and build a bigger recipe-corpus. Thus far, I’ve built a model that classifies 12 different vegetables, which I often keep in my refrigerator. Considering that my accuracy is ~96% for these 12 classes, I’d like to add more vegetable classes, as well as adding fruits. I’d also like to incorporate the ketogenic-diet-friendly option; I had made a function for it, but decided to abandon it to make the app prototype simpler.
-
Topic modeling improvement . Although the top 8 keywords in each topic seem reasonable, some of the recipes seem to be miscategorized. For example, marinara sauce is considered as a dessert (in the category as chocolate sauce). I may need to consider a food2vec-like embedding to resolve this issue. Alternatively, I could increase the number of components in the NMF model, or perhaps use different modeling techniques.
-
Real-time video detection. At some point, it would be nice to incorporate live-video feed as the input for the image classifier. Perhaps I could explore Google’s TensorflowLite platform and build on top of it.
-
Automated recipe generation. I had started training a Recurrent Neural Network model on AWS, to generate salad recipes using my corpus. Although the initial result seemed somewhat promising, it took a long time to train the network. Also, word repetition occurred frequently, indicating that the network parameters weren’t properly tuned (yet). So I’d like to explore this project further.
Data Sources and Highlights of Tools
-
Recipes from Epicurious
-
Training data (images) from Google Images
- Data acquisition:
BeautifulSoup,google-api - NLP and data analysis:
nltk,nmf - CNN kits and architecture:
keras,tensorflow,MobileNetV2 - Model deployment:
Flask,ngrok, andapple scriptto simulate live-access phone app
Attribution
-
I modified Ryan Lee’s scripts to suit my webscraping needs
-
This google-image-download package is great for collecting images